- LatencyMon and PerfMon are the most reliable tools for measuring and diagnosing DPC latency on modern Windows.
- GPU, network, and USB drivers are often the main culprits of DPC spikes; their power management is key.
- Processor power plans and idle states play a significant role; adjusting thresholds and core parking helps.
- Using DDU/NVCleanstall, MSI mode, and chipset drivers reduces residual processes and improves latency stability.

If your PC is experiencing audio crackling, stuttering while playing video, or seems to “hang” for no reason, there is a common suspect: DPC latencyThis delay, invisible to the naked eye, can ruin a DJ set, a recording in your DAW, or an online game when you least expect it. That's why it's important to know Measure DPC latency in Windows and find solutions.
To help you, we have compiled a series of practical procedures and tools that really workWe've integrated the best of several real-world experiences: from using LatencyMon and PerfMon, to power tweaks, services, GPU drivers (NVIDIA/AMD), and other tricks.
Why is it important to measure DPC latency in Windows?
The DPCs (Deferred Procedure Calls) are jobs that the kernel defers to handle hardware interrupts more calmly; when they accumulate or run for too long, the delay is triggered and audio micro-cuts, video stuttering or small interface freezes appear.
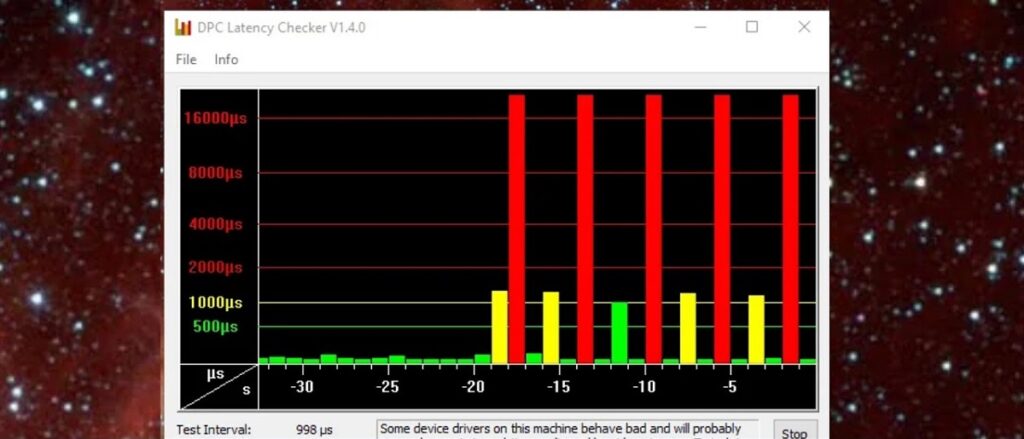
Typical symptoms include audio clicks, stuttering in full-screen video, or dropped frames, and often coincide with peaks of tens of thousands of microseconds. A typical case: a computer that is idle for around 1000–20000 µs and when I put a video in full screen it triggers, even after disconnecting a second monitor.
Reliable tools to measure DPC latency in Windows
In Windows 7, you can use DPC Latency Checker (DPCLAT)It's simple and shows whether the system can handle real-time flows, although in modern versions of Windows it's no longer the recommended method.
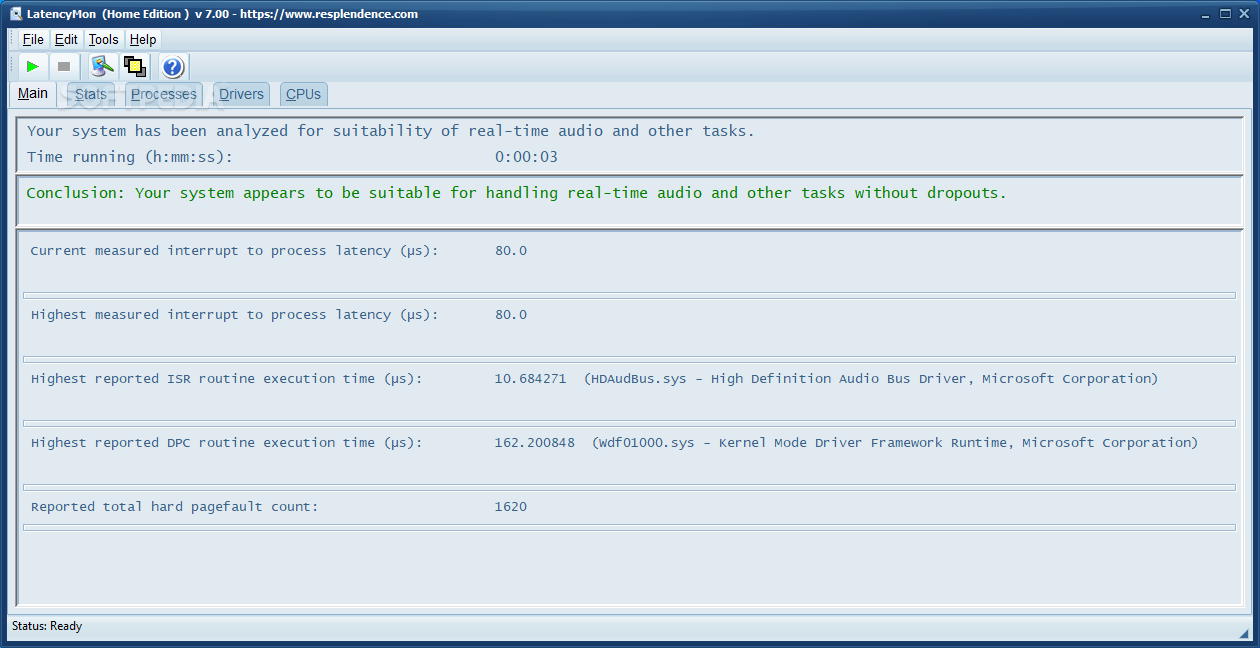
For Windows 8, 10 and 11, the reference is LatencyMon. Just press the Play button and let it run while you use your computer (playing games, playing videos, opening programs). Although it was created for audio professionals, it measures the system's ability to process real time and tells you what driver or process is causing problems even if you don't have a sound device connected.
Usual culprits and how to act
Before analyzing the methods for measuring DPC latency in Windows, let's see what are the elements that most commonly cause the problem:
- ndis.sys (network). This is usually related to Wi-Fi/Ethernet adapters. Try disabling Wi-Fi and NICs from Device Manager and compare measurements; if it fails, check the network driver or change the manufacturer's driver to a generic one (or vice versa).
- ohci1394.sys (FireWire). If you're using IEEE 1394 devices, disconnect them during testing; update FireWire drivers; and check for IRQ conflicts, especially with the GPU. On motherboards with integrated FireWire, a dedicated PCI/PCIe card may provide better performance. sustained latency.
- usbport.sys (USB controller). Download the latest chipset drivers from your motherboard manufacturer's website. There were documented improvements in Windows 7 SP1 (KB2529073). In rare cases, SD/MMC/CF card readers have caused high DPC; disable their entries in Device Manager and see if the graphics improve.
- nvlddmkm.sys (NVIDIA). Update from nvidia.com, remove telemetry with clean installs, and check IRQs. This module is notorious for DPC spikes with aggressive power management; it's also sometimes affected by chipset drivers, so it's a good idea to use it. always update them.
- ACPI.sys (power management). Common on laptops. Disabling selective suspend, adjusting the power plan, and in extreme cases, disabling the ACPI battery in Device Manager may help, knowing that you could lose battery charging capacity. It's a drastic remedy and should be tried with clear precautions.
Practical actions to reduce DPC latency
Start with the basics: in BIOS/UEFI and Windows, disables aggressive power-saving features (C-States and similar), use the High Performance plan and check temperatures. These are basic adjustments, but they lay the groundwork for the rest of the changes to take effect.
Disable USB selective suspend in your power plan (both AC and battery). You'll alleviate storport.sys latencies and stabilize USB storage and audio devices.
With Power Settings Explorer (run as administrator), show hidden processor settings: find “Processor Idle Demote Threshold” and “Processor Idle Promote Threshold”, uncheck them, and then, in Power Options > Processor Power Management, set both thresholds to 100%. This reduces CPU idle transitions and trims down the peaks. of kernel and drivers.
In the same Power Options, adjust: “Processor performance: minimum core parking” to 100% (AC and battery), “Minimum processor state” to 100% and “Maximum processor state” to 100%. For “Disable processor idle”, leave “enable idle” as is if your computer tolerates it better. These changes minimize “core parking” and avoid latencies when “waking up” threads, although they consume more and raise the temperature.
Perform a clean install of GPU driversIn the 3D Control Panel, choose "Prefer maximum performance." On AMD, use DDU, extract the driver package, and cancel the installer. Then, in Device Manager > Display Adapters, select "Update Driver" and point to the extracted directory. This will install the bare-metal driver without any extras.
Activate MSI mode on your GPU with MSI Utility v3 (as admin), select MSI for the GPU and set the priority to High. Reboot and test. This mode reduces interrupt contention and can reduce stuttering in games.
Uninstall “Windows Update Health Tools” If you have it. For some reason, several people experience lower latency after removing it, knowing that you'll lose the wizard that checks if your PC is eligible for Windows 11 and could block certain updates; it's a conscious exchange.
Install the chipset drivers directly from your motherboard manufacturer. Windows usually leaves them decent, but the official package fine-tunes USB, PCIe, storage, and timers—four pillars that influence DPC much more than you'd think.
Extra optimization for real-time audio (DJs, DAWs, streaming)
If you use your computer only for DJing or recording, you can go further. In [Task Manager > Services], disable extra services from your laptop manufacturer (e.g., LG), because they consume CPU and generate periodic calls that end up increasing your computer's performance. DPC queues.
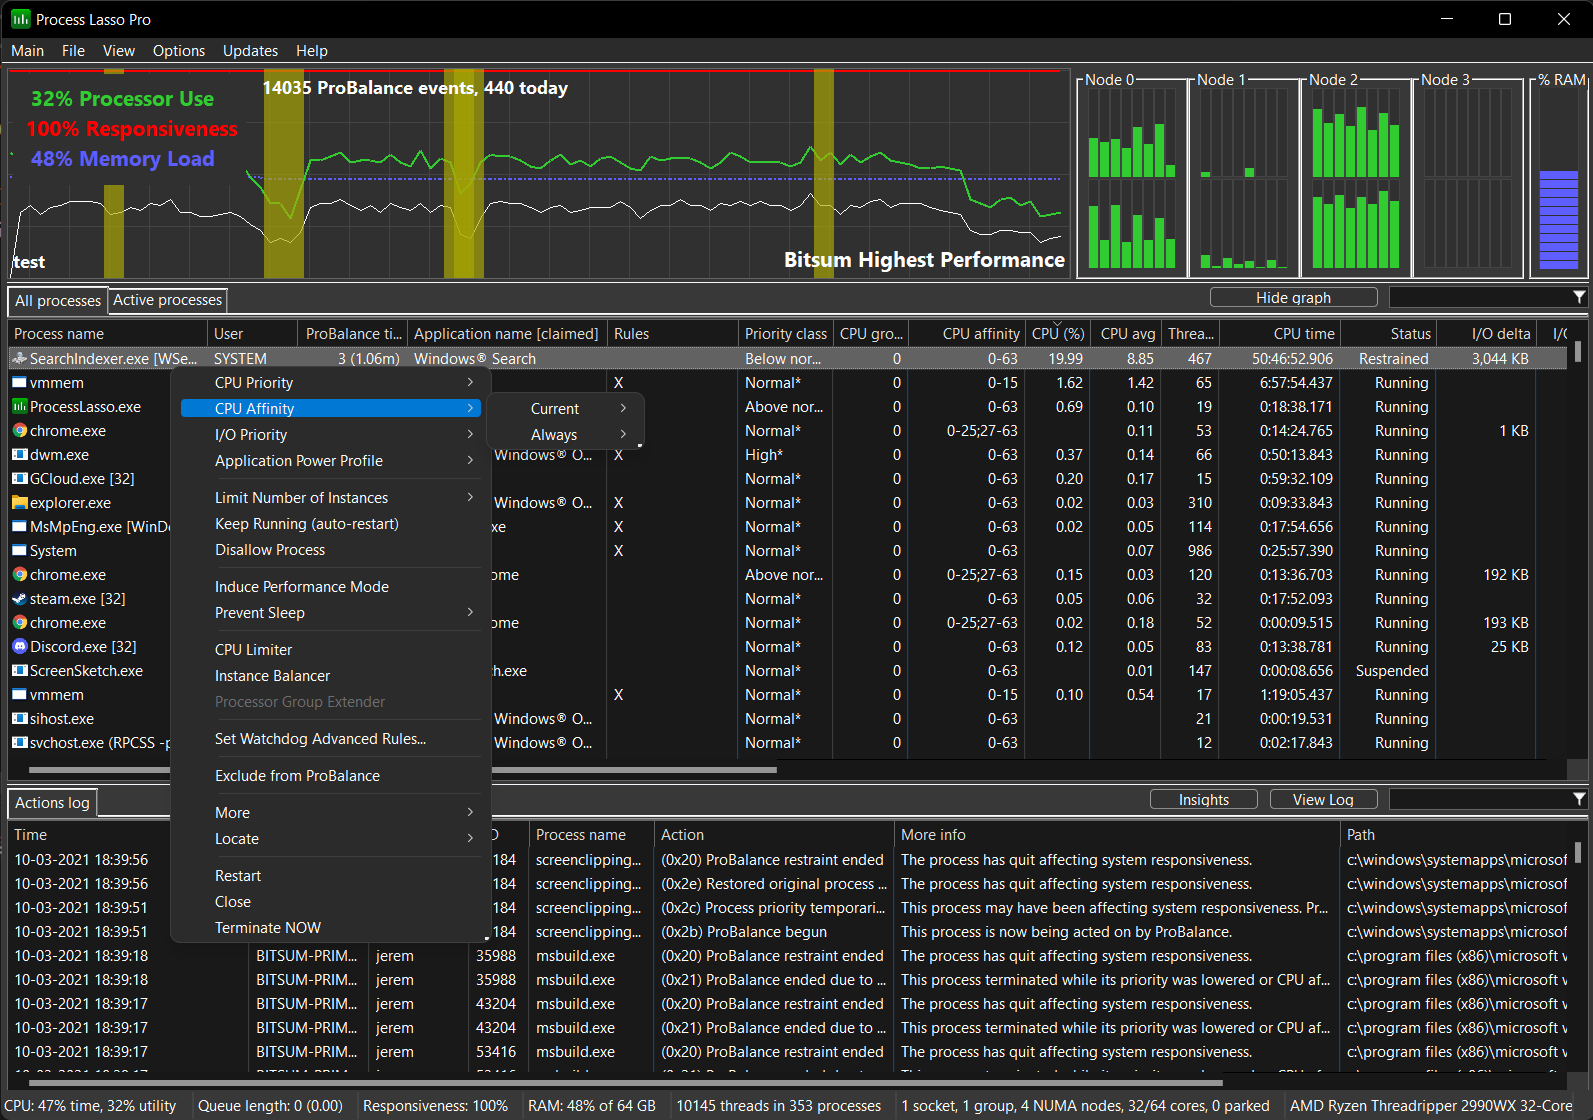
With Process Lasso (free), while your DJ software is open (e.g., Traktor), find it and set: CPU Priority “Above Normal” and I/O Priority “High”. This pushes its processing ahead of noisy processes and reduces jitter in the pipeline. real-time audio.
For Windows audio services, search for “audiosrv” and “AudioEndpointBuilder” (both inside svchost.exe), and set their CPU Priority to “High” and I/O Priority to “High.” Also, under CPU Affinity, limit their execution to a few cores (e.g., leave only the last two active) to stabilize caches and reduce migrations between cores, which helps hold buffers without peaks.
Under System > Advanced Settings > Performance, check “Processor Scheduling: Background Services.” For professional audio, this option prioritizes system services that handle I/O, improving buffer delivery to drivers and endpoints.
Virtual memory: For dedicated audio installations with sufficient RAM, you can try “No paging file” on all drives; it reduces page faults on disk, but is risky if other programs are requesting a lot of memory. If you're unsure, leave the paging file managed by the operating system.
PerfMon: Measuring system bottlenecks step by step
PerfMon (Performance Monitor) can record Windows metrics at intervals and draw graphs. Access it with Windows + R, type "perfmon" and that's it. It can be used to detect if disk, CPU, memory, network, or processes are reaching their limits and are behind a DPC latency out of standard.
Objects and Counters: An “Object” groups data (e.g., PhysicalDisk), a “Counter” measures something concrete (e.g., \PhysicalDisk\% Idle Time), and “Instances” separate resources (each physical disk or each CPU core). Key difference: PhysicalDisk summarizes hardware, and LogicalDisk measures partitions; in LogicalDisk, you’ll see drive letters or mount points, and their average _Total sums up the access for all the discs.
To register with Accommodation From the console (admin), you can create generic and SQL datasets. Save the files to C:\perflogs or wherever you prefer; these example commands cover disk, memory, network, CPU, process, and system with a 5-second interval and a circular size:
Logman.exe create counter Avamar -o "c:\\perflogs\\Emc-avamar.blg" -f bincirc -v mmddhhmm -max 250 -c "\\LogicalDisk(*)\\*" "\\Memory\\*" "\\Network Interface(*)\\*" "\\Paging File(*)\\*" "\\PhysicalDisk(*)\\*" "\\Processor(*)\\*" "\\Process(*)\\*" "\\Redirector\\*" "\\Server\\*" "\\System\\*" -yes 00:00:05 Logman.exe start Avamar Logman.exe stop Avamar
For default SQL: add counters specific to SQL Server and adjust the instance name if it is not the default:
Logman create counter Avamar_SQL_perf_log -f bin -c "\\Network Interface(*)\\*" "\\Redirector\\*" "\\Paging File(*)\\*" "\\Memory\\*" "\\PhysicalDisk(*)\\*" "\\LogicalDisk(*)\\*" "\\Server\\*" "\\System\\*" "\\Process(*)\\*" "\\Processor(*)\\*" "\\SQLServer:Databases(*)\\*" "\\SQLServer:Buffer Manager\\*" "\\SQLServer:Memory Manager\\*" "\\SQLServer:SQL Statistics\\*" -yes 00:00:05 -max 800 -cnf 0 -o C:\\SQL_Performance_Logs\\AvamarSQL_perf_log.blg
Main counters and thresholds useful for diagnosing DPC through system resources, with indicative limits:
- Memory: % Committed Bytes in Use > 80% sustained indicates a small pagefile; Available Bytes below 5% of installed RAM is worrisome (and <1% is a definite problem); Committed Bytes should not vary much (if it grows, the pagefile expands); Pool Nonpaged Bytes > 80% sustained can lead to event 2019; Pool Paged Bytes > 70% of maximum can lead to event 2020.
- Processor: High % Interrupt Time reveals a lot of hardware activity; % DPC Time above 25% sustained is investigated; % Privileged Time ideal <30% on web/app servers; % Processor Time >90% (1 CPU) or >80% (multi) sustained points to saturation and possible spikes queue latency.
- Grid: Packets Received Discarded > 1 and Packets Received Errors > 2 suggest hardware or network buffer problems; check drivers, cables and NIC configurations.
- Disk: % Idle Time measures actual disk inactivity (higher is better). Avg. Disk Queue Length less than twice the number of spindles is usually a good sign. Latency: Avg. Disk sec/Read (excellent < 8 ms; good < 12 ms; acceptable < 20 ms; bad > 20 ms) and Avg. Disk sec/Write (excellent < 1 ms; good < 2 ms; acceptable < 4 ms; bad > 4 ms). Ideal Split I/Os close to zero (fragmentation/stripe-size); LogicalDisk % Free Space > 15% (recommended > 25%) to avoid degradation due to filling.
- Process: Handle Count (leaks), Virtual Bytes (reservation), Working Set (residents). Uncontrolled growing values accompany DPC increases if the process generates many interrupts or blockages. Frequent I/O.
Other useful counters: System\File Control Operations/sec and System\File Data Operations/sec to see overall file activity, System\Processor Queue Length for CPU queue, Processor\Interrupts/sec and Processor\DPCs Queued/sec to quantify interrupt and DPC load on a computer. real time.
BIOS settings, devices, and warnings
In BIOS/UEFI, disable devices you don't use (legacy Drive A, serial port, parallel port, integrated audio if you use an external interface), and stepping technologies like Intel Speed StepAMD K8 Cool & Quiet, Intel Virtualization Technology, or C1E CPUs if you don't need them. Caution: On laptops and PCs that virtualize, this can be counterproductive; document changes and test them individually.
In Device Manager, you can disable unnecessary hardware (duplicate sound cards, TV tuners, internal modems, card readers, or redundant Ethernet adapters), without touching disks, IDE/ATAPI/SATA controllers, mouse, keyboard, or the primary GPU. One user resolved high DPC latency by disabling the Microsoft High Definition Audio controller which shared IRQ with the NVIDIA GPU, maintaining sound with the Realtek driver and thus eliminating the conflict.
For NVIDIA, if the clicks disappear when you push maximum performance and open a 3D app, you already have a clue: power management was the culprit. You can stick with that stable setting, fine-tune further with clean drivers and MSI mode, or, if nothing works, consider a GPU without aggressive power-saving policies that cause state oscillations.
After running through tools, common culprits, and fine-tuning, it's clear that measuring DPC latency in Windows with LatencyMon/PerfMon and judiciously addressing power, drivers, and devices makes all the difference: where you used to see spikes of 1.000–2.500 µs (or even 20.000 µs), you'll now see steady green bars, clean audio, and smooth video. The added bonus is that you know exactly what you tweaked and why it worked, which is the surest way to keep the DPC latency under control in the long term.
Editor specialized in technology and internet issues with more than ten years of experience in different digital media. I have worked as an editor and content creator for e-commerce, communication, online marketing and advertising companies. I have also written on economics, finance and other sectors websites. My work is also my passion. Now, through my articles in Tecnobits, I try to explore all the news and new opportunities that the world of technology offers us every day to improve our lives.

