- It allows you to monitor the availability of websites, TCP ports, DNS, and Docker containers for free and self-hosted.
- It integrates with over 90 notification services, such as Telegram and Discord, to alert you of outages in real time.
- It offers the creation of public status pages to inform users about the health of services.
- It is easily deployed using Docker, facilitating data management and system updates.

How can you monitor a website with Uptime Kuma and receive alerts if it stops working? Imagine you have your entire digital ecosystem set up, whether it's a NAS server at home, a container cluster, or your business website, and suddenly you receive a message from a desperate customer saying they can't log in. It's a serious blow to your reputation and, above all, a sign that you're managing your infrastructure reactively. The reality is that depend on luck para saber si tus servicios funcionan es un error garrafal que hoy en día no podemos permitirnos si queremos dormir tranquilos.
Para evitar estos sustos, necesitamos pasar a una estrategia proactiva mediante un sistema de alerta temprana. Aquí es donde entra en juego Uptime Kuma, una joya del código abierto que nos permite monitor availability of anything that breathes on the network without having to spend a penny on monthly subscriptions. It's basically having your own private control center where you're in charge of the data and decide exactly how and when you want to be notified if something stops working.

What exactly is Uptime Kuma and why is it so powerful?
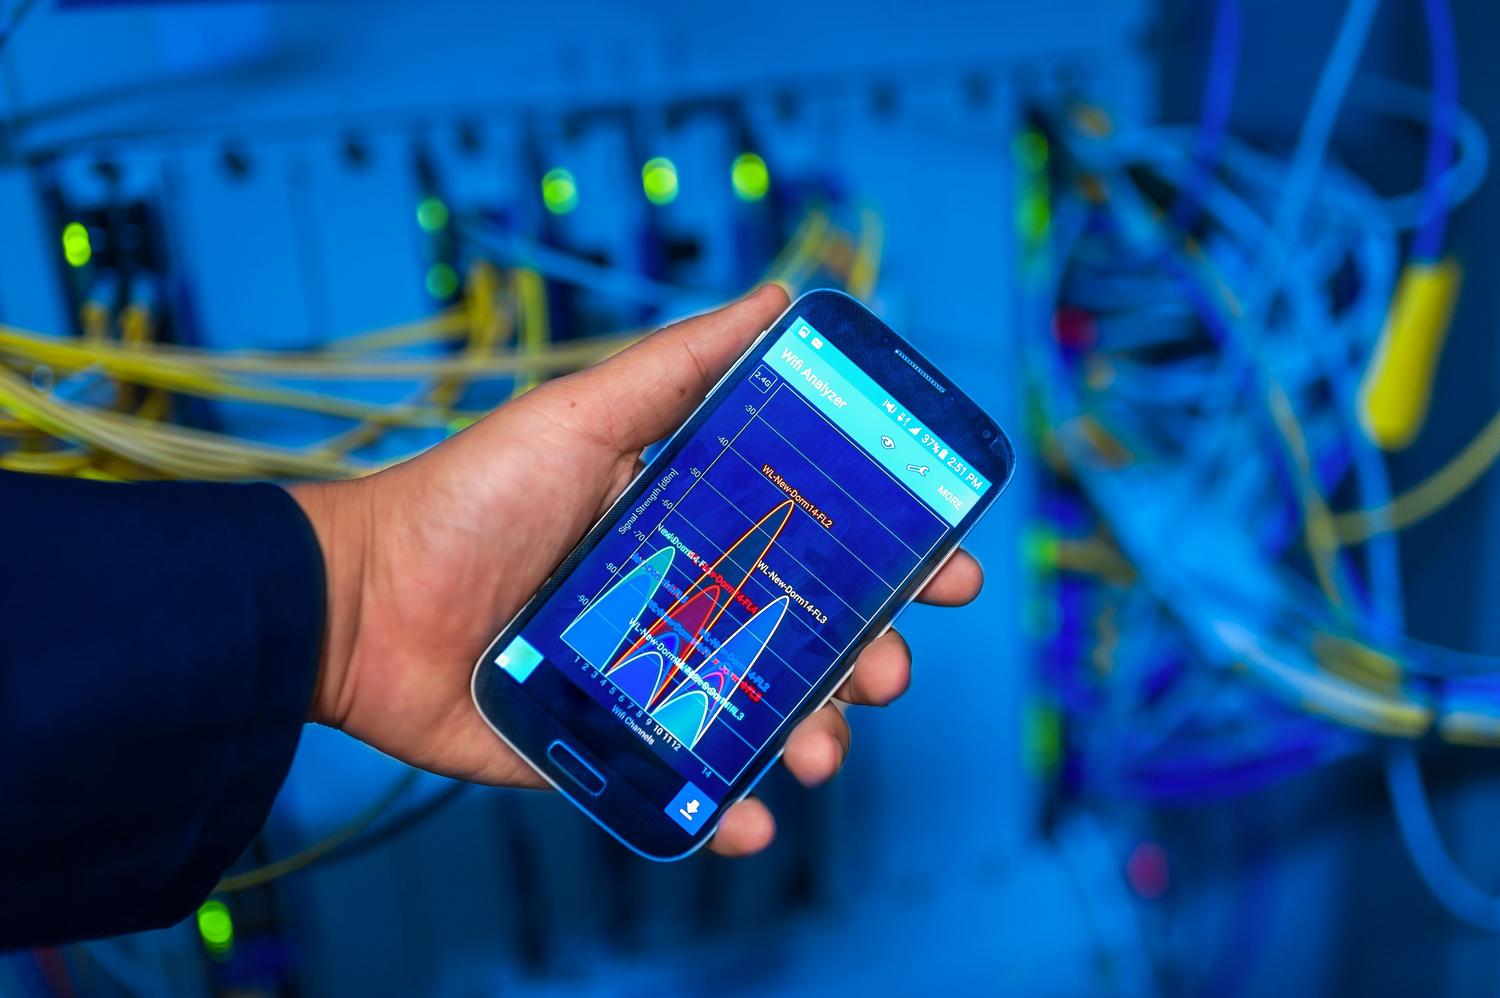
Uptime Kuma is a self-hosted monitoring tool, written in Node.js, that has become a favorite alternative to services like UptimeRobot. Its main advantage is that You have absolute control, evitando que tus datos residan en servidores de terceros. Además, destaca por una interfaz moderna, reactiva y sumamente intuitiva que no requiere que seas un gurú de la informática para ponerla a punto en unos pocos minutos.
Desde el punto de vista técnico, es un software extremely lightweightIn idle mode, it consumes only about 200 MB of RAM, making it ideal for installation on modest hardware like a Raspberry Pi 5 or a budget VPS. It doesn't just check if a website loads; it offers impressive versatility for monitoring everything from TCP ports to specific Docker containers.
Surveillance capabilities: what can we monitor?

The power of this tool lies in the fact that it goes beyond the surface level. You can configure different types of monitors depending on what you need to monitor:
- HTTP and HTTPS: Perfect for websites and APIs. It not only checks that the server is responding, but also allows you to monitor the SSL certificate expiration para que no te pillen desprevenido con el aviso de «Sitio no seguro».
- Ping (ICMP): The quickest way to find out if a device, such as a router or IP camera, is accessible on the network.
- TCP Ports: Ideal for monitoring that databases such as MySQL, PostgreSQL or Redis have the open port and accept connections.
- DNS: Verify that the records resolve correctly, avoiding propagation problems.
- Docker containers: If you mount the Docker socket, Kuma can tell you in real time if a The specific container is in a running state..
- Keyword monitors: This is the expert level. It allows you to search for specific text within the HTML. So, if the server responds (Code 200) but the website displays a database error or is blank, the system It will trigger the alarm. because the keyword does not appear.
- Other protocols: It supports Steam game servers, MQTT for home automation, and push-type monitors, useful for backup scripts that notify the system when they have finished successfully.

Installation and deployment: the Docker way

To avoid cluttering the base operating system and to facilitate updates, the recommended option is to use Docker. For those seeking speed, a command docker run It's sufficient, but ideally you should use Docker Compose para centralizar la gestión y asegurar la persistencia de los datos.
Es fundamental definir un volumen para el directorio /app/databecause that's where the SQLite database with all your configuration resides. If you want to monitor other containers on the same host, you must mount the file /var/run/docker.sock in read-only mode. Once the service is up, usually in the port 3001, lo primero es crear una cuenta de administrador con una contraseña robusta para evitar intrusos.
Si planeas exponer el panel al exterior, lo más sensato es colocarlo detrás de un reverse proxy such as Nginx, Traefik, or Caddy. It is vital to correctly configure the Upgrade and Connection headers, as Uptime Kuma uses WebSockets to update the dashboard in real time without having to refresh the page manually.
Setting up alerts and smart notifications
A monitor that doesn't notify you is just a pretty picture. Uptime Kuma shines by integrating with over 90 notification services so you receive alerts on your mobile device instantly. Among the most popular options are: Telegram (creating a bot via BotFather), Discord, Slack, email via SMTP, or through a Complete NTFY guide for setting up notificaciones push.
Para evitar que el móvil no pare de sonar por microcortes o picos de latencia, un truco esencial es ajustar los heartbeat re-attemptsSetting up 2 or 3 retries before triggering the alert ensures you only wake up at 3 a.m. if the problem is... really persistent and not just a momentary network failure.

Status page management and maintenance
A key feature is the creation of public status pages. Puedes generar una URL personalizada donde tus clientes o usuarios vean si el servicio está caído sin saturar tu soporte técnico. Estas páginas son totalmente flexibles, permitiendo añadir logos y agrupar monitores por categorías (por ejemplo, API, Frontend y Base de Datos).
Para evitar que el historial de disponibilidad se vea afectado por caídas programadas, existen las maintenance windowsYou can schedule periods where alerts are automatically silenced and the status page displays a maintenance notice, maintaining the transparency with the user end.
Optimization and security tips
To ensure the system runs smoothly, don't overuse check intervals. While a critical service might need to be checked every 60 seconds, a weekly backup script can have a much longer interval. do not overload resources del servidor. El uso de etiquetas personalizadas es clave para organizar los monitores por entorno, diferenciando entre producción y test.
En cuanto a la seguridad, si la herramienta está expuesta a internet, activar la two-factor authentication (2FA) It is mandatory. Furthermore, since all the configuration is on the Docker volume, it is imperative to perform frequent backups de ese directorio para no tener que empezar de cero en caso de desastre.
Si quieres llevar tu monitorización al siguiente nivel, considera instalar Uptime Kuma en un different node to the server that centralizes your services. If the main server goes down, the monitor will remain active on another machine (such as an SBC or a cheap VPS) and will be able to alert you. Combine this with metrics tools such as Prometheus and Grafana or learn How to monitor a Linux server using Glances te dará una visión completa: sabrás no solo si el servicio está arriba, sino también cómo está la salud de la CPU y la RAM.
Implementar este sistema transforma la gestión de cualquier infraestructura en un proceso transparente. Al unir la facilidad de Docker, la inmediatez de Telegram y la visibilidad de las páginas de estado, logras un ecosistema donde los Faults are detected in secondsminimizing downtime and regaining full control over your web availability.


Passionate about technology since he was little. I love being up to date in the sector and, above all, communicating it. That is why I have been dedicated to communication on technology and video game websites for many years. You can find me writing about Android, Windows, MacOS, iOS, Nintendo or any other related topic that comes to mind.